How We Integrated Security into Development (On the Second Try)

Hi, I’m Fedor, an Engineering Manager at an ordinary tech company. Like many companies outside Big Tech, we face the daily grind of tight budgets, lean teams, and putting long-term goals on hold because of urgent issues. But here’s the thing: working with constraints doesn’t mean we can’t build great things. Ordinary companies are filled with extraordinary people who know WHAT to do. The key is figuring out HOW to navigate the limitations and deliver meaningful results we’re proud of. This blog is about sharing those strategies. I’ll write from an engineering manager’s perspective, but you’ll also find technical insights and practical code along the way. Do you have thoughts or feedback, or do you want to connect? Hit me up on LinkedIn — I’d love to hear from you.
Have you ever heard, "Our users just don’t get how great our product is, and there’s nothing we can do about it"? I guess not. That’s never a winning mindset. We know that for a product to succeed, we should invest time and energy into creating a smooth user experience.
But what about your team’s experience? Have you ever considered how often your developers feel bogged down by their tools? Have you ever introduced a new tool or process to your team only to watch it flop for mysterious reasons?
The truth is, poor usability might be holding your team back, just like it can with your users. We would be much better prepared to tackle complex challenges if we evaluated and improved our team's tools from a usability standpoint, just as we do for our customers.
I’ll share how we integrated security into our development process in this article. It didn’t go well initially, but things turned around when we focused on improving the team's experience.
Surprisingly, Grafana was the tool that played a key role in solving our usability challenges. By leveraging it, we transformed the entire process into something far smoother and more effective for the team. Let me show you how a simple shift in approach made a world of difference.
A Big Change That Didn’t Happen
Our project was 25 years old, and over the years, a significant number of security issues had accumulated. Luckily, our company’s security team had already set up a vulnerability management tool called DefectDojo and linked it to 17 scanners to catch all sorts of problems—vulnerable dependencies, server misconfigurations, leaked secrets, you name it.
The plan was for each team to start fixing security issues in a couple of repositories. As the team progressed, the security team would expand the scans to more repositories until we had improved security posture across the company.
But after a year, neither my team nor others had really made much progress. The security team had done their part, so why weren’t we fixing the issues?
Maybe I need to start micromanaging and pushing my team harder to focus on security? I prefer to believe people have good intentions. Instead of asking, “Why don’t my teammates want to improve security?” I asked, “Do the tools we have help to take action?”
A quick check confirmed the problem. Then, I reworked the given tools. And guess what? In the next four months, we eliminated 7700 findings (97% of our security issues) and made security a usual part of our development process.
Spotting the Problem with the Tools
I spent some time using DefectDojo myself to try and fix security issues. I quickly saw why the team was struggling.
1. High Cognitive Load
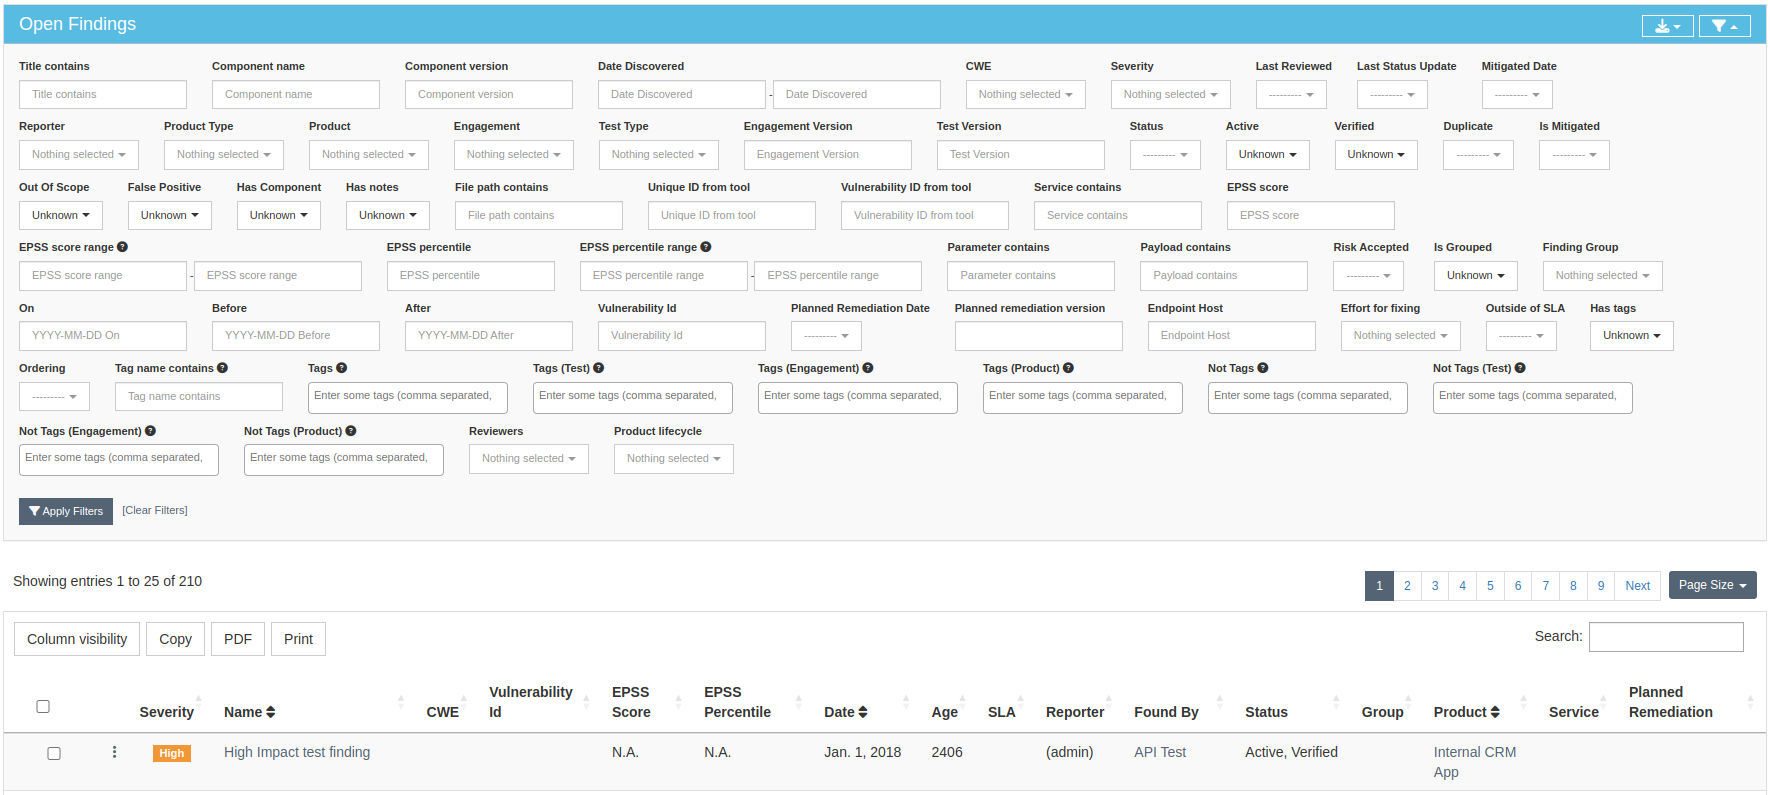
DefectDojo was overwhelming, especially for those of us who aren’t security experts. The workflow wasn’t intuitive, and even filtering issues to figure out what to tackle next felt complicated:
The scanners flagged around 800 issues with just two repositories configured and that was already overwhelming. But we had 30 more repositories to configure!
2. Poor Performance
Our initial DefectDojo setup wasn’t optimized, so each user action took 10–15 seconds. The security team improved this over the next six months, but we needed to clear our backlog faster, and waiting wasn’t an option. So, I offered the security team our help with database tuning but continued researching alternatives.
3. No Feedback Loop or Sense of Progress
After a week of fixing 50 issues, I felt like I’d barely made a dent. It was like taking a cup of water from a lake. With 30 more repos to configure, I knew we’d find thousands more issues, and in front of such a volume, I simply gave up.
Moreover, new issues kept popping up while I worked on the old ones. I had no idea if my effort was even making a difference. I couldn’t answer the simplest questions: Am I making progress? Are new issues appearing faster than I can fix them?
Reducing the Friction
To fix these issues, I dove into DefectDojo’s domain model, API, and internal database structure. Eventually, I decided to pull the data into Grafana for better visualization.
I created an SQL view to safeguard sensitive data and grant limited access, ensuring the process was secure. I was also concerned about the tight coupling with DefectDojo's database structure. Still, after a year and several DefectDojo updates, the created view never broke, proving this solution is reliable enough.
It took me two days to implement and demonstrate the initial dashboard to my teammates. I then spent another couple of days tweaking it based on their feedback and sharing it with our managers to ensure they could see our progress, too.
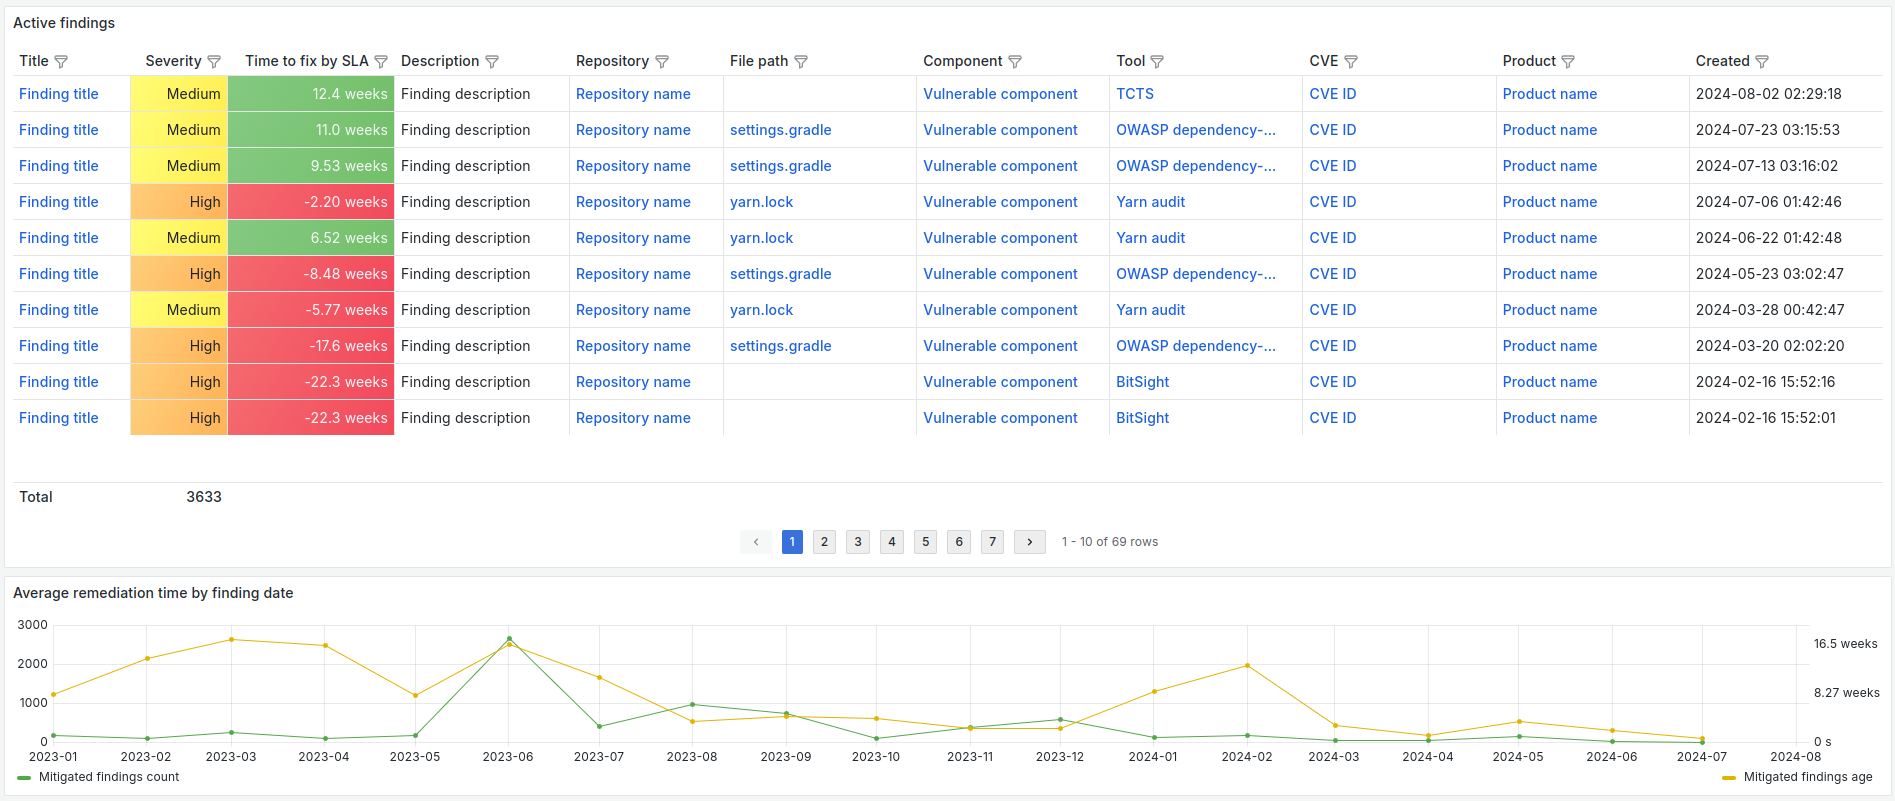
Here are the essential sections of the resulting dashboard:
The dashboard completely solved performance issues due to direct database reads. Additionally, it masked DefectDojo’s complexity and minimized cognitive load since we were familiar with Grafana and loved it.
The biggest win was how easy it became to filter issues based on what we needed to work on next. Now, the team could glance at the dashboard, see what needed attention, and get started—no more complicated filtering or jumping between tools.
But the final piece of the puzzle was providing a real sense of progress.
Making Progress Feel Tangible
I wanted simple yet meaningful indicators to capture both the number and severity of security issues. Fixing a complex, high-severity issue should be as rewarding as fixing dozens of low-severity ones.
So, I added a “Vulnerability Index,” where each issue had a numeric weight based on severity: Info/Low = 1, Medium = 10, High = 100, Critical = 1000. We began tracking it alongside the raw number of findings.
Next, I decided to make the history of previous efforts very visible.
Goodhart's Law warns that when a metric becomes a goal, people tend to manipulate it, intentionally or not.
So, If we only track the current findings count and Vulnerability index, we might be tempted to keep these numbers low by... not adopting new scanners.
I wanted to encourage curiosity and proactivity instead. So, an increased metric shouldn't be discouraging. By looking at our past ups and downs, we can say, "This spike is from when we integrated Scanner X, and here's how long it took to fix all the issues it found."
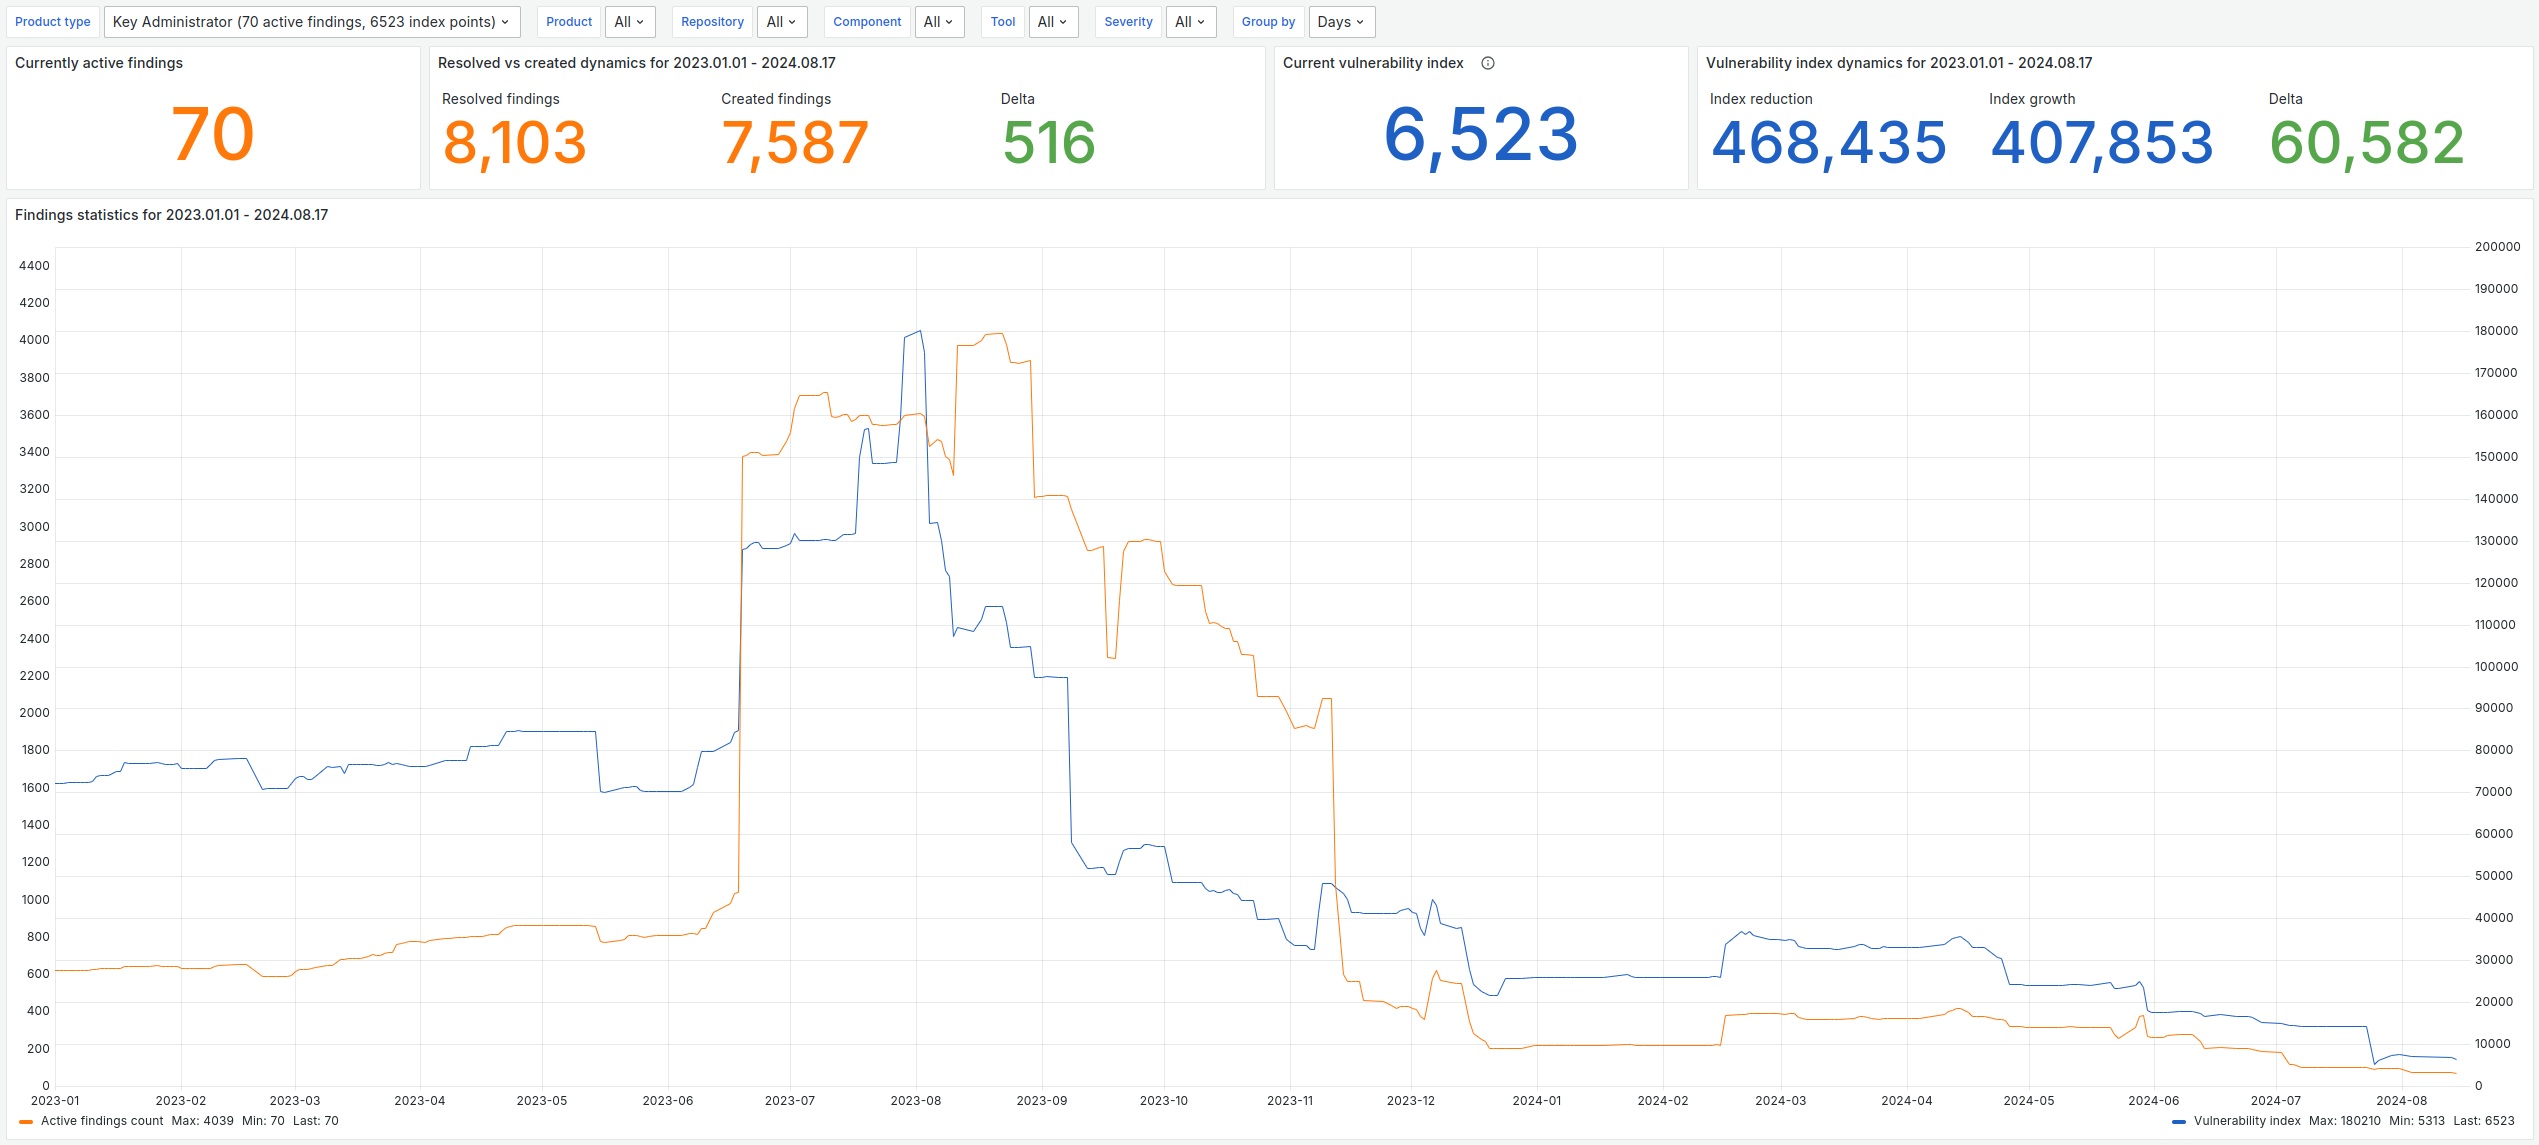
With this in mind, let’s return to the dashboard's "Overview" section. It displayed the findings count (in orange), the Vulnerability Index (in blue), and their historical trends:
This visual representation of progress made everything feel more tangible. We’d run a security scan every time we fixed something and see the numbers drop. It was incredibly satisfying, almost like a game — the dopamine hit kept us motivated!
Armed with this dashboard, we activated every available scanner across all 30 repositories and started improving our security posture as of August 2023.
Of course, creating the dashboard was just the beginning. While it made investigating issues much easier, the next challenge was streamlining the process of solving them.
Streamlining the Issue-Solving Process
Our idea of streamlining was simple: gradually move to a point where fixing a security issue is the easiest choice, easier than discussing its importance or priority.
One area we focused on was third-party tools. When a vulnerability is found, we can check its impact, review network access to our tool, and decide whether to fix this vulnerability. Another option is to leverage Infrastructure as Code (IaC) and make a no-brainer update to the latest version instead of analyzing the vulnerability. This is a very beneficial strategy, considering the repeatable nature of security efforts. If moving to IaC seems too much work, at least you can containerize the tool using Docker and track new versions that way.
We took the same approach with secrets management. We could investigate every secret found to check whether it was a test secret, whether the production value differs, whether this secret appeared in release artifacts, and whether there are chances that it leaked outside. Another option is to adopt a secrets management system like Vault and reroll such secrets in the first place. We chose the latter.
The same works with dependency management. However, this topic deserves a separate section in the article.
Automating Dependency Management
About 40% of our security issues were related to vulnerable dependencies. Updating dependencies is repetitive, so the more we can automate, the better. Ideally, we wanted to "shift left" and update all dependencies on day zero—before vulnerabilities became widely known.
To achieve this, we adopted the Renovate bot. This powerful tool tracks all our dependencies—Java, Python, JavaScript, Docker, and Gradle—and automatically creates pull requests whenever a new version is available.
Even though Renovate’s documentation is great, configuring it for a large-scale project like ours took time. I spent two weeks setting it up and working through dependency updates to ensure the team would get everything they needed. Once I felt confident, I introduced Renovate to the team, made myself available for questions, and fine-tuned the configuration based on teammates’ feedback.
I recommend following their best practices and user stories if you're starting with Renovate. Below are a couple of additional tips from our experience.
Weekly Batch Updates
We run Renovate weekly and set it up to group all non-major dependency updates into one pull request per repository. We also use a consistent branch name for these pull requests. This setup lets us automatically create a staging environment and run unit and end-to-end (e2e) tests on the proposed updates.
This approach helps us catch potential issues, including runtime errors while sleeping. By the time the team begins their work, all checks are already completed, reducing the noise from constant updates.
Here’s the grouping preset we used:
{
      "groupName": "all non-major dependencies",
      "matchDatasources": ["maven", "npm", "pypi"],
      "matchUpdateTypes": ["digest", "patch", "minor"],
      "matchPackagePatterns": ["*"],
      "branchName": "renovate-non-major-updates-batch"
}
Codeowners Plugin for Reviewer Assignments
Another great addition to our setup was the Codeowners plugin. This tool works with all popular source control management systems and automates the assignment of reviewers for pull requests. We configured it as follows:
If a person manually starts the Renovate pipeline, they are automatically assigned the related pull requests.
If a scheduler starts the pipeline, the pull requests are assigned to the engineer on third-line support duty.
For larger or more complex repositories, the reviewer is randomly selected from the Codeowners list to ensure no one is overwhelmed by constant Renovate updates.
With this setup, we avoided burdening individual team members with repetitive PRs while ensuring all dependencies were regularly updated.
Integrating Developed Tools Into Existing Workflows
One of the biggest challenges in software development is dealing with constant context switching. Developers often have to juggle a variety of disjointed tools—CI/CD systems, source control, task trackers, observability tools—and this back-and-forth can really slow things down.
When we started our security journey, we already had a custom Slack bot in place, which was a great foundation for improving our overall security workflow. I previously wrote on how you can create your bot from scratch. Here’s how we improved this bot to streamline our security efforts:
Slack Commands for Renovate: We set up Slack commands to run Renovate scans and check on existing pull requests, eliminating the need to switch between the CI tool and the source control system. Everything could be done from within Slack.
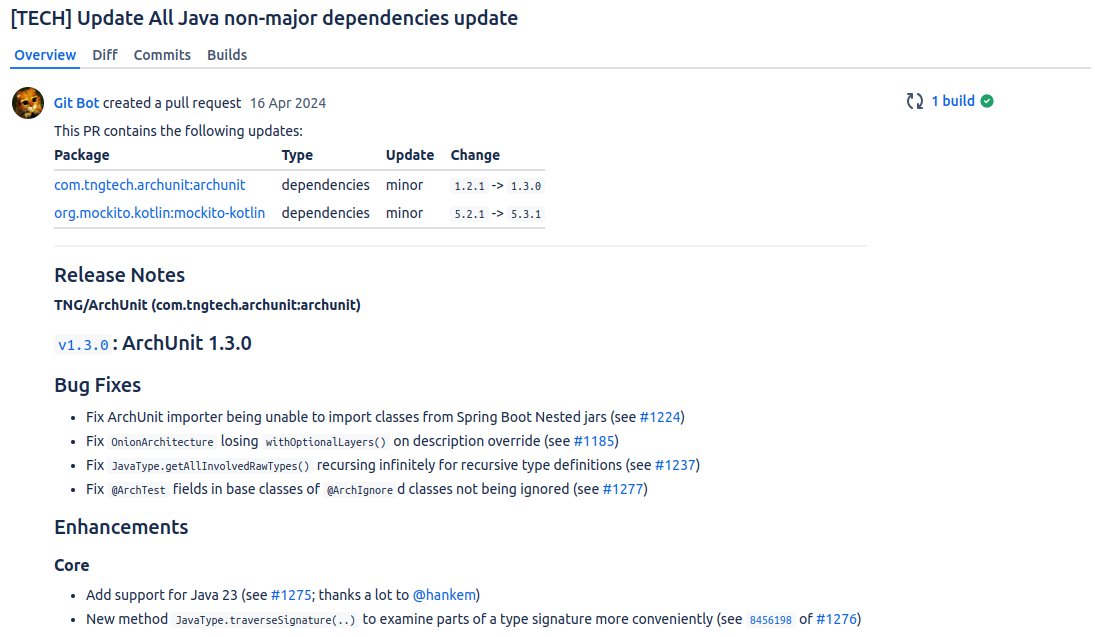
Integrated Renovate PRs management: Whenever Renovate creates a pull request, the assigned reviewer receives an instant notification in Slack, complete with release notes. The reviewer was also kept in the loop about build statuses and test results.
Integrated Notifications: The team got periodic reminders about pending Renovate PRs that needed attention. In addition, we configured Grafana to send alerts about emerging security issues directly to Slack, allowing us to respond quickly.
These changes drastically reduced the need to switch between different systems. We don’t have to remember to check DefectDojo or Grafana to stay on top of security issues — they come to us in Slack. Plus, we can update dependencies without ever leaving Slack, making the whole process more efficient and keeping the team more focused.
Over the past year, Renovate has created over 1,200 pull requests for us. This helps us keep up with vulnerabilities and update dependencies easily, allowing the team to focus on more important tasks.
Conclusion
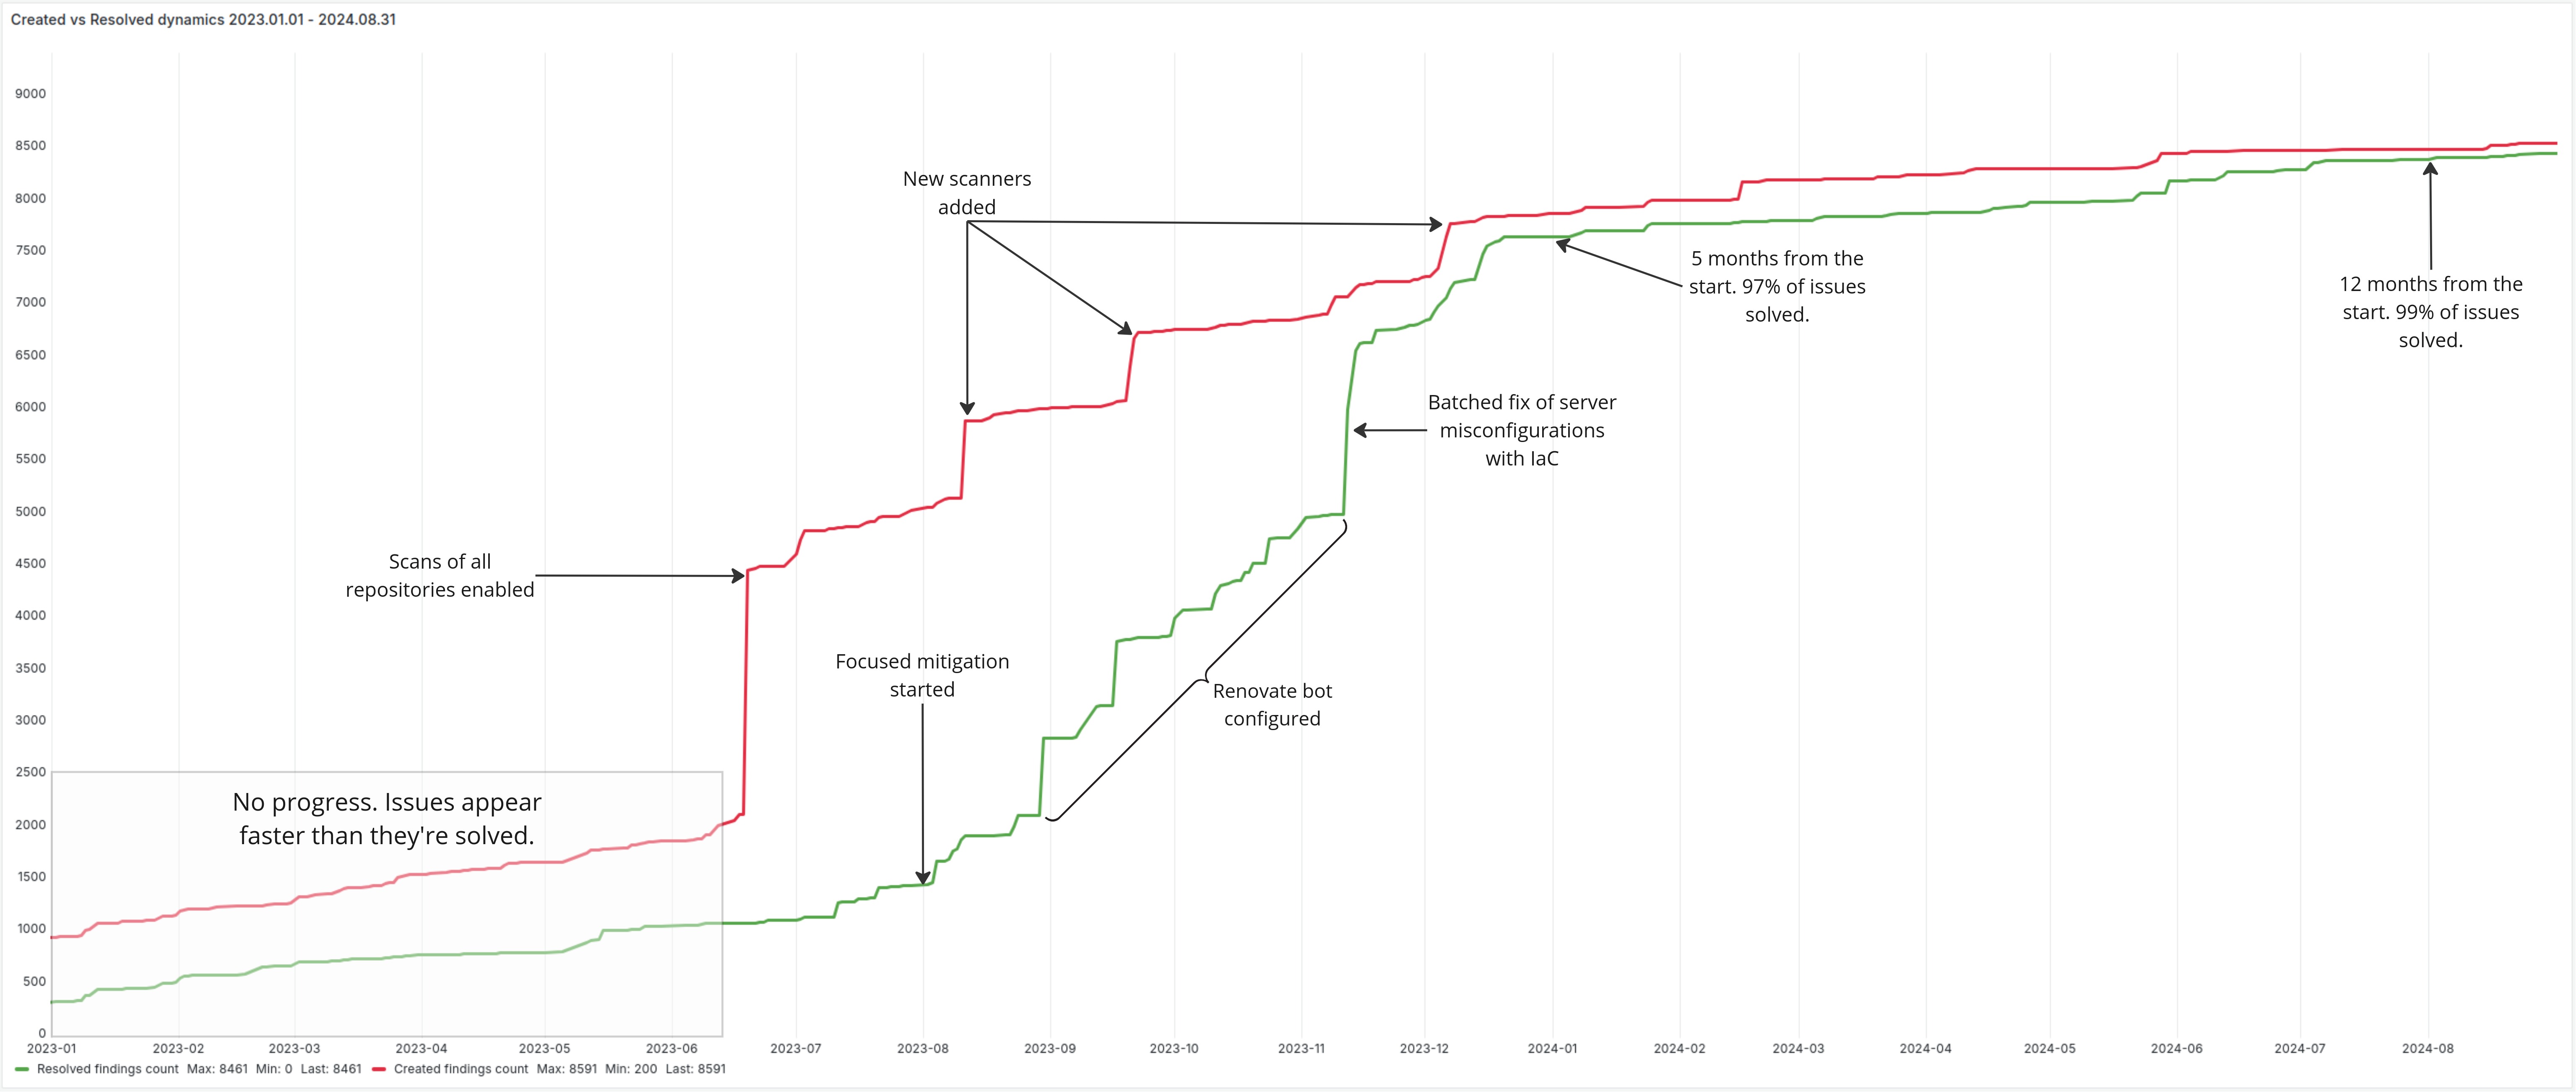
In just 12 months, we eliminated 99% of the security debt accumulated over the past 25 years. More importantly, we integrated security into our development process to ensure continuous improvement moving forward.
Here’s a snapshot of the entire journey in one simple graph showing Created (red) vs. Resolved (green) issues:
The key to success was providing the team with the right tools and making ongoing improvements based on their feedback.
All the changes I’ve mentioned took just 17 workdays — a small fraction of the overall security efforts. Plus, it wasn’t just my team that benefited — other teams have also adopted and benefitted from our tools.
If you're interested in learning from our experience, feel free to explore the Grafana dashboard, SQL view, and Renovate pipelines mentioned in this article.
Do you have your own story of improving developer experience to drive success? Please share it in the comments!
Life is so beautiful,
Fedor
